If you want to connect IoT MQTT data to Excel, there is a really quick and simple method that you can use.
DASYLab is an application that allows you to develop custom applications without programming. Why is that important? The straightforward answer is, while a programmer would be able to write the program, is the programmer available & does the programmer know exactly how to do it without having to “figure it out” (figuring it out takes more time, and more time is more money). The great thing about an application that can be customized without a programmer getting involved, you can get it done yourself without getting anyone else involved.
DASYLab is a graphical programming data acquisition software package that provides tools & functions to quickly develop applications by using drop and drag graphical programming icons.
So how does that help connect IoT MQTT data to Excel?
MQTT subscribing and DDE linking are the main 2 capabilities you need to bring together to allow you to connect IoT data into Excel.
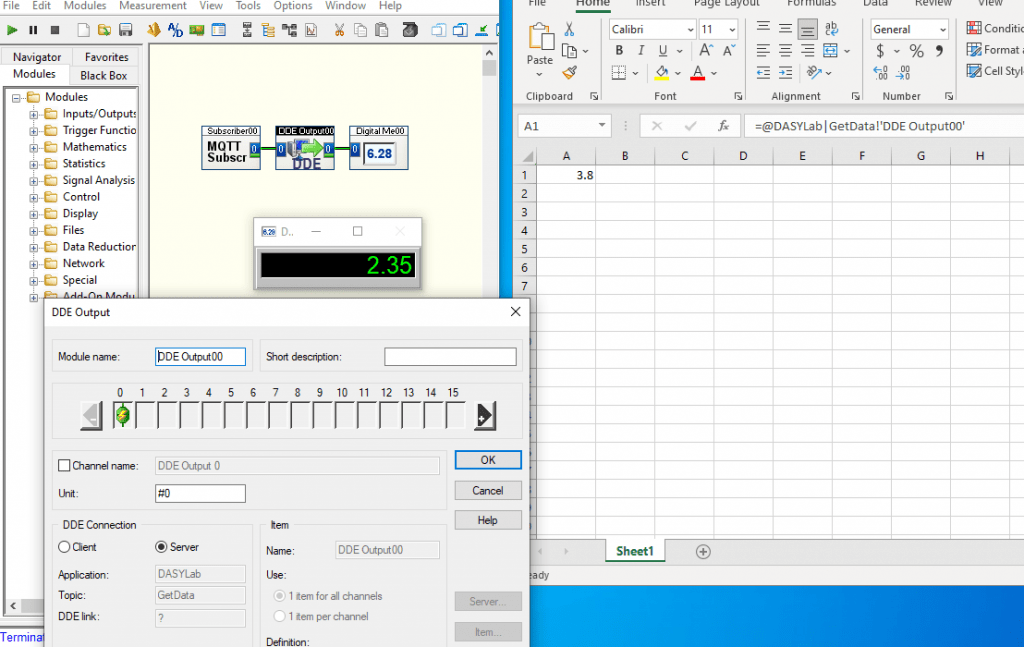
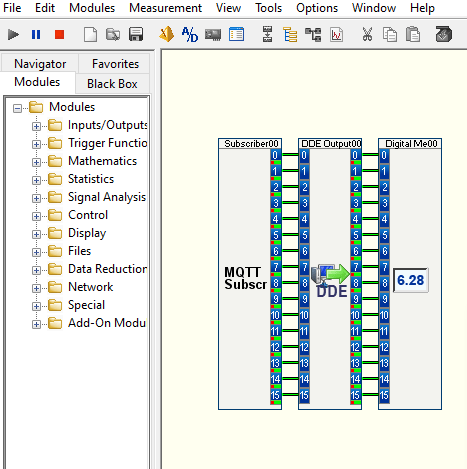
DASYLab has a variety of available functions that can help you connect MQTT to Excel without coding. The 2 main functions are the DASYLab MQTT Module and DASYLab DDE Module. It really takes just starting a new application “Worksheet”, adding the 2 modules to the worksheet”, connecting the 2 modules together, configuring them with the MQTT and DDE parameters, and “Running” the worksheet.
While getting a single stream of sensor data connected in an IoT format to Excel is good, in many remote monitoring applications it is important to read more than 1 sensor. DASYLab can connect quite a few MQTT modules and DDE modules together. In addition, each module pair can handle up to 16 sensors.
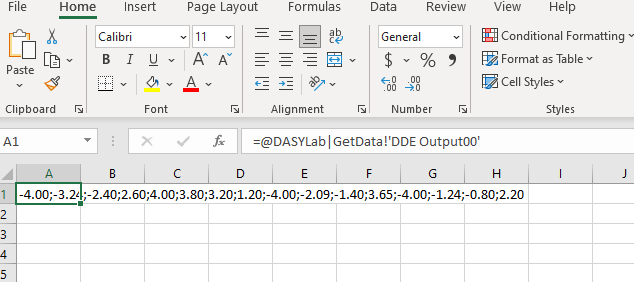
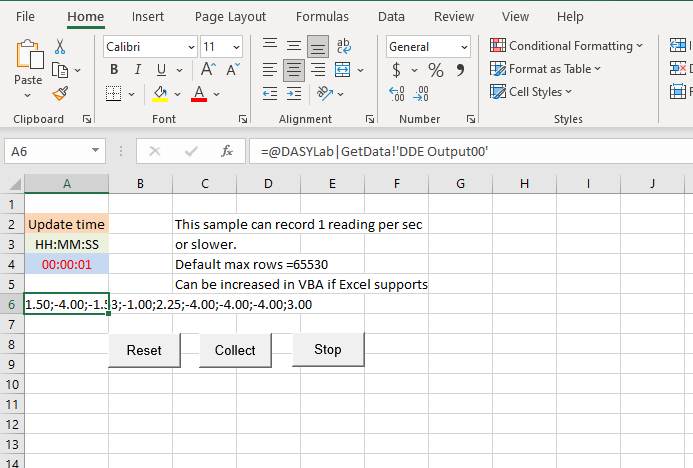
How DASYLab connects the values of multiple sensors in a single DDE module, is as a single string.
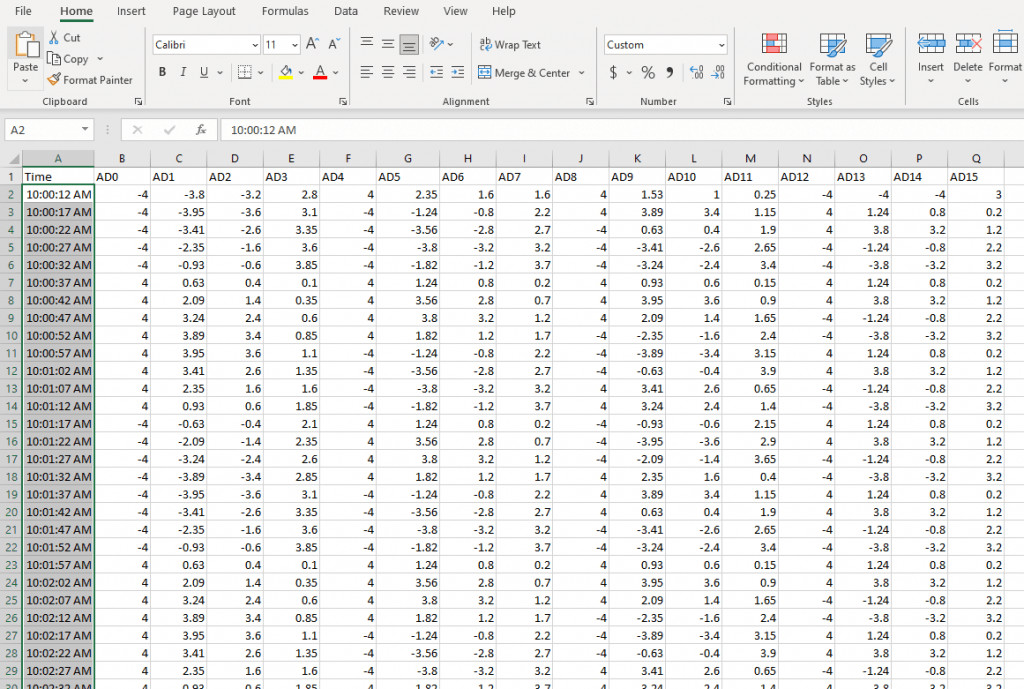
Once the values are in brought using DDE for the IoT MQTT data to Excel connection, may things can happen. The linked data can be recorded as a table of the readings over time.
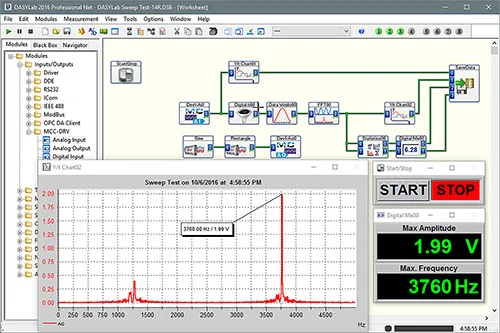
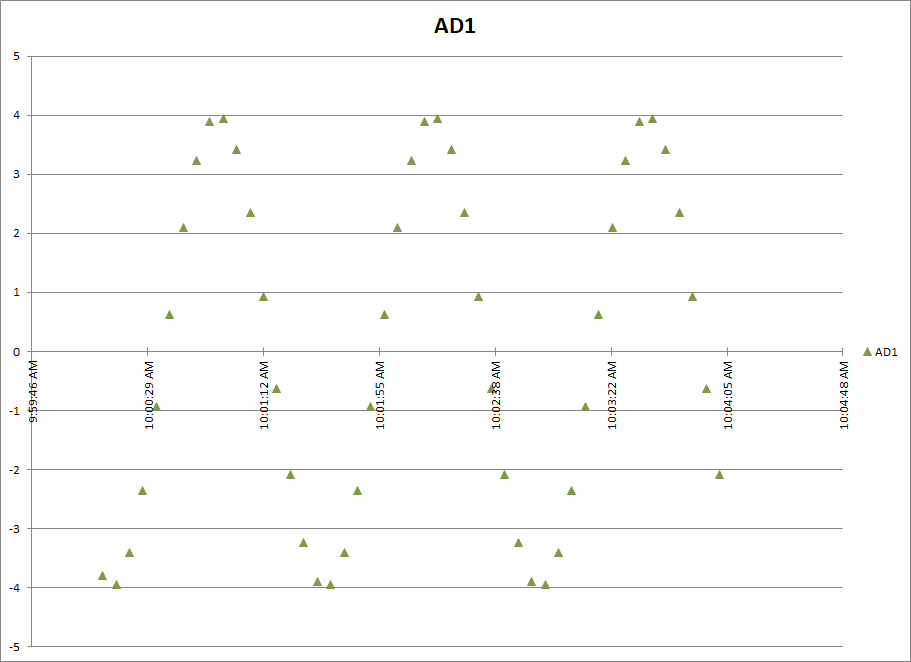
The recorded sensor values can be plotted individually as trend over time.
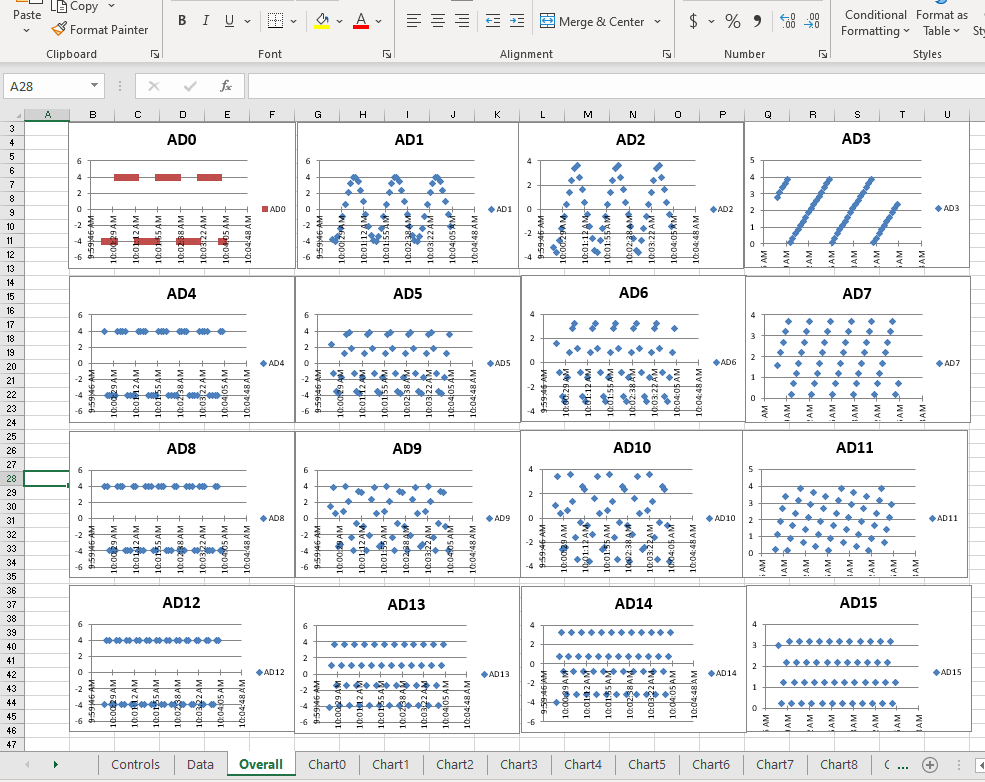
The sensor data can be shown as plots in an overall fashion.
To make the string of values usable as individual values in Excel, it is going to take an Excel Macro, written in VBA code.
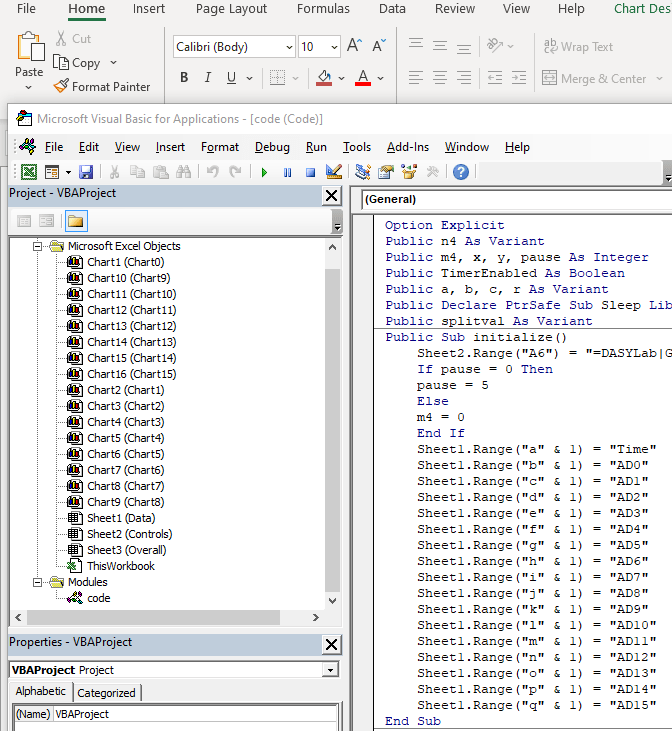
Once the VBA code is involved, besides just manipulating the data to make it usable, controls can be added to the new written in Excel “Application”, to make it do what you want when you want it done.
DASYLab works with Modbus. DASYLab works with MQTT. DASYLab works with DDE. Excel works with DDE. An entire chain of pieces is needed and can be used, to connect a sensor monitoring PC on your property, to the internet as an IoT system. If you would like to get it done, but are not sure, we can help. Ask us about software assistance!
Ask us about custom software, screens and recording setup to your needs!
Solutions for wireless data acquisition and monitoring. With applications in the agricultural, oil, wastewater monitoring, refrigeration and building management industries. Products that can reshape the way companies’ access, monitor, and stay informed about their systems, 24/7.